What are “sound frequencies” anyway?

If you have ever encountered a noise problem, you have probably heard your subject matter expert talk about "frequencies." This is a short-hand way of talking about the frequency content of the noise control problem at hand. It is a critically important consideration, because noise control treatments are generally most effective at a particular frequency, or range of frequencies. Some noise regulations even specify sound level limits on a per-frequency basis.
Sounds can contain one or many frequencies at once. This post presents a way of thinking of how sound comprises different frequencies. If you have ever studied Fourier Series or Fourier Analysis, you may already get the gist, but check out the note below for a very interesting take on it.*
A couple of quick notes:
- If "math" makes your skin crawl, do not worry, we will not go too deep here. Focus on the concepts and you should get value out of this post.
- I place technical terms in parentheses. If you find that distracting, feel free to skip over them for a more comfortable read.
Physically, sound is air molecules vibrating back and forth. One molecule knocks into its neighbor, which does the same to its neighbor, etc., and the sound propagates as a compressional (longitudinal) wave.** If the sound wave finds your ear, you might hear it, and you might call it noise if you happen to find the sound unpleasant. As a molecule of air moves back and forth (oscillates), it crosses its center position (equilibrium) with some degree of regularity. The air can cross its center position more or less frequently, depending on the wave. We call the number of back-and-forth cycles that occur in a given second the frequency (frequency of oscillation). The unit of frequency is Hertz, abbreviated Hz (named in honor of Heinrich Hertz, a famous physicist). As an example, one would say that something moving back and forth 100 times every second would have a frequency of 100 Hz. Human hearing ranges from 20 Hz to 20,000 Hz.
Now, I want to present three straightforward concepts in words and pictures, that when put together, reveal one way of thinking about how sound can consist of multiple frequency components.
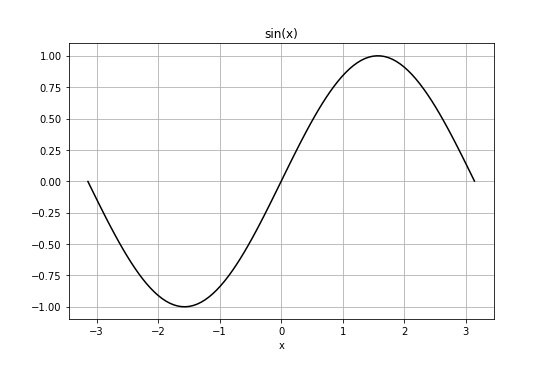
Concept #1: We can represent wave motion using a mathematical sine (or cosine) wave.
If it has been a while since you have seen a graph of a sine wave, one is shown in the figure below.
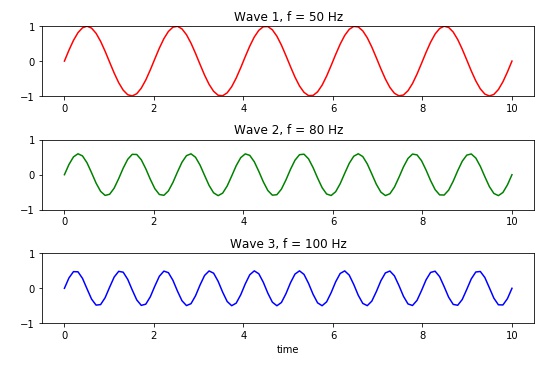
Concept #2: We can (mathematically) add individual waves together to form a new wave.
The figure below shows three sine waves, each having different frequency (50, 80 and 100 Hz) and height (amplitude). Note how in the same 10-second time window, a single wave (like that shown above) repeats itself more often, or more frequently, the greater the frequency of the wave.
These three individual waves can be added together to form a more complex, total wave (resultant). The figure below shows the mathematical addition of the three waves above:
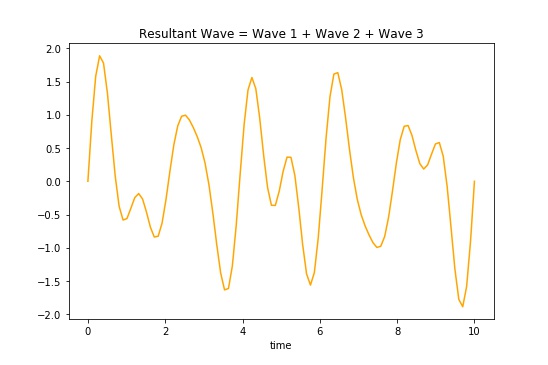
This addition of waves (superposition) is not just a mathematical contrivance. Real sound waves add together by this superposition principle. The math just helps us figure out a way of thinking about it, and gives us a way to help explain what happens in nature.
Now we turn to the question of looking at the above process in reverse. What if we have a complex sound, which is made up of many frequencies, and we want to know which frequencies are present and by how much? This is where Fourier analysis comes in.
Concept #3: Fourier analysis is the opposite of adding waves together.
One way to think about it, is that Fourier analysis is figuring out what frequencies are contained in a complex sound and by how much. We say that the sound is resolved into its frequency components through Fourier analysis.
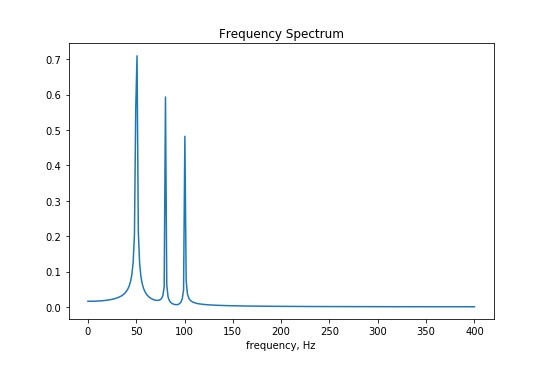
Performing this Fourier Analysis takes us from sound level-versus-time (the time domain) to level-versus-frequency (the frequency domain). We call this level-versus-frequency graph the frequency spectrum, which displays the frequency components of the sound. Much like a prism or rainbow reveals the color spectrum of visible light (light frequencies), an acoustical spectrum shows us the sound frequencies (frequency components) of complex sounds.
The figure below shows the frequency spectrum of the resultant wave shown above after Fourier analysis was performed. Note that you can see "spikes" at the three frequencies that we began with in the individual waves, namely 50, 80, and 100 Hz. Also, note that the heights (magnitudes) of the frequencies correspond to the heights (amplitudes) of each respective wave.
Fourier analysis in a nutshell, and a way to think of sound as comprised of many frequencies, is summarized below:
- A single wave of single frequency can be represented as a sine (or cosine) wave.
- Waves can be added together to form a complex waveform.
- Fourier analysis unpacks (resolves) a wave comprising many frequencies into the wave's individual frequency components.
I hope that by walking through this quick tour of Fourier analysis, it helps you to better conceptualize just how sounds are comprised of different frequencies, and how we can figure out which ones are present. Not to throw a curve here at the end, but some may be familiar with or wondering about octave bands. Typically, octave bands are used to measure sound levels and for noise control design, rather than Fourier analysis (which is sometimes called "narrowband" analysis to distinguish the two). Octave bands are another way to view the frequency content of a complex sound and conceptually is similar to Fourier analysis. The take-home message here is that complex sounds contain multiple frequencies and a frequency spectrum shows us what those frequencies are.
Notes:
*Here is a fantastic video if you are already familiar with Fourier Series (or even if you are not). It is 8-1/2 minutes long, but the first 3-1/2 does the heavy lifting:
What is a Fourier Series? (Explained by drawing circles) - Smarter Every Day 205
**Here is a quick, 24-second video that illustrates the wave types
 About the Author - Tim Simmons, Ph.D. - USSI Director of Industrial Acoustics
Dr. Tim Simmons manages USSI's Industrial Acoustics Department. Tim comes to USSI with a wealth of Acoustical and Noise Control knowledge and real-world experience. Tim holds a Ph.D. in Physics from the University of Mississippi and a B.S. in Engineering Physics from the University of Tennessee.
Member INCE, ASA, ASME